Long Buildup, Short Buildup, Short Covering and Long Unwinding
Research & Invest · Updated 8 Nov 2026 · Education, not advice
Long buildup, short buildup, short covering and long unwinding are four terms Indian F&O traders use every day. Each one describes a combination of how price moved and how open interest changed. Together they form a simple 2×2 framework for reading what futures and options traders might be doing. This guide explains each case, how to read it, and where the framework breaks down.
What is open interest?
Open interest (OI) is the number of derivative contracts that are still open: opened by a buyer and a seller and not yet closed, exercised or expired. It is different from volume.
- Volume counts every contract traded in a session, including trades that open and close the same day.
- Open interest counts only positions that remain outstanding.
OI rises when a new buyer and a new seller open a fresh position. It falls when an existing buyer and an existing seller both close. If one trader closes and another opens to take their place, OI stays the same.
That is why change in OI, read with change in price, gives a clue about whether money is coming into a contract or leaving it.
Price vs open interest: the 2×2 table
| Open interest rises | Open interest falls | |
|---|---|---|
| Price rises | Long buildup: fresh buying, new long positions being added | Short covering: existing short sellers buying back to close |
| Price falls | Short buildup: fresh selling, new short positions being added | Long unwinding: existing long holders selling to close |
The framework is usually applied to futures, where price and position direction are straightforward. It can also be applied to individual option strikes, with care, as explained below.
What is long buildup?
Long buildup means price up and OI up. New positions are being opened and the buyers are willing to pay higher prices to get in. It suggests fresh long interest.
Illustrative example: a stock future rises from ₹1,000 to ₹1,030 in a session, and OI rises from 50 lakh to 56 lakh shares. That 12% increase in OI along with a 3% price rise would be labelled long buildup.
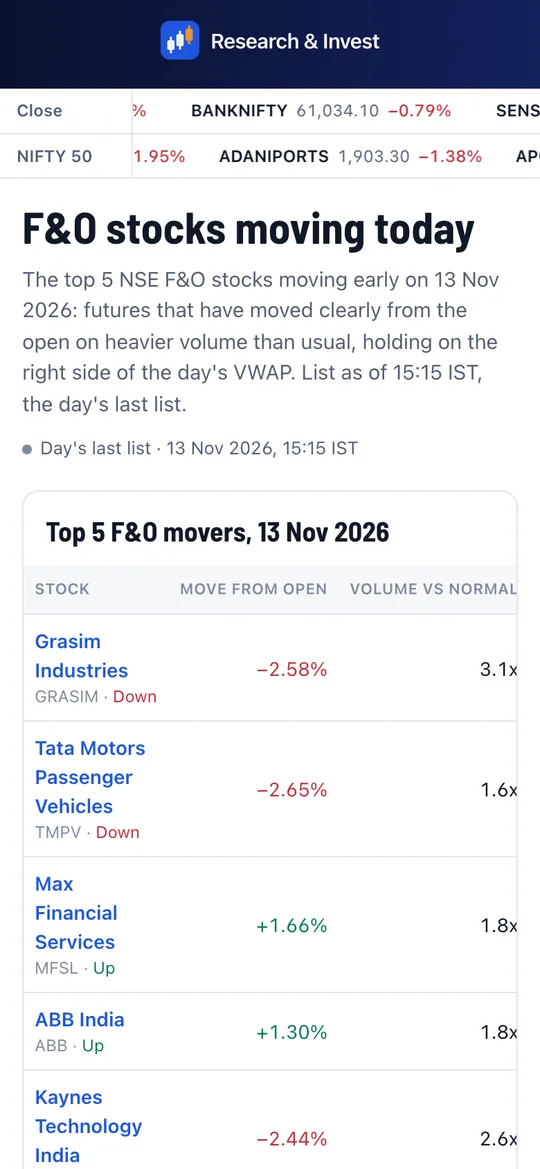
See today's list on our long buildup stocks page.
What is short buildup?
Short buildup means price down and OI up. New positions are being opened, and the sellers are the ones pushing price lower. It suggests fresh short interest.
Illustrative example: a stock future falls from ₹1,000 to ₹975 and OI rises from 50 lakh to 55 lakh shares.
See today's list on our short buildup stocks page.
What is short covering?
Short covering means price up and OI down. Positions are being closed, and price is rising, which suggests traders who were short are buying back to exit. Short covering rallies can be sharp, because shorts often need to exit quickly when price moves against them, but they can also fade once the covering is done because no fresh buying is behind them.
Illustrative example: a stock future rises from ₹1,000 to ₹1,040 while OI falls from 50 lakh to 44 lakh shares.
See today's list on our short covering stocks page.
What is long unwinding?
Long unwinding means price down and OI down. Positions are being closed and price is falling, which suggests traders who were long are selling to exit, either booking profits or cutting losses.
Illustrative example: a stock future falls from ₹1,000 to ₹980 while OI falls from 50 lakh to 46 lakh shares.
See today's list on our long unwinding stocks page.
How to read OI buildup in options
For options, the 2×2 table applies to the option's premium, not the underlying's price, and the meaning flips for writers:
- Call premium up, call OI up: fresh call buying (long buildup in that call).
- Call premium down, call OI up: fresh call writing (short buildup in that call), often read as writers expecting the underlying to stay below that strike.
- Put premium down, put OI up: fresh put writing, often read as writers expecting the underlying to stay above that strike.
- Put premium up, put OI up: fresh put buying.
Option premiums also fall with time (theta decay) and with drops in implied volatility, even if the underlying does not move. So a falling premium with rising OI is not always aggressive writing. Read more in option Greeks explained.
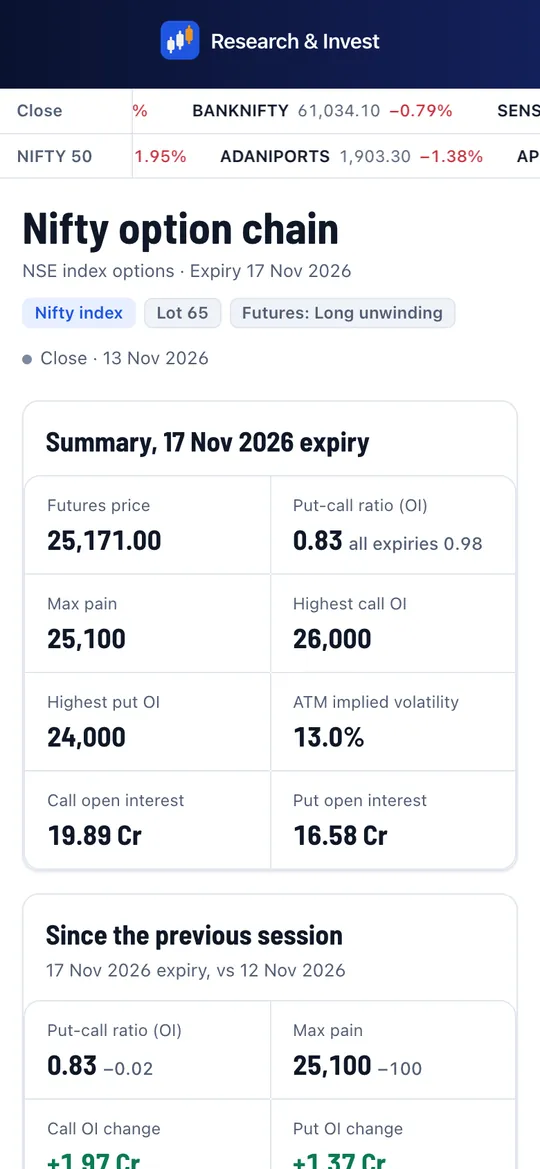
You can see strike-wise change in OI on any option chain, for example the Nifty option chain.
How big a change counts?
Small moves in price or OI are mostly noise. Most screens apply some threshold, for example a minimum percentage change in OI and in price, before labelling a stock. There is no single correct threshold. When comparing lists from different sources, check how each one defines the cut-off and which period it compares (previous day, previous hour, or start of the series).
Also watch for rollover periods near monthly expiry. As traders close the current month and open the next, OI falls in the near contract and rises in the next one. Looking at a single contract during rollover can show "long unwinding" that is really just positions moving forward. Combining OI across all months for that stock gives a cleaner reading. Check expiry dates on the F&O expiry calendar.
What are the limits of the OI buildup framework?
- Every contract has two sides. For every new long there is a new short. The labels describe which side appears to be more aggressive, inferred from price, not a count of bulls and bears.
- Hedges and arbitrage. Many futures positions are hedges against cash holdings or part of cash-futures arbitrage. A short buildup in a stock future may simply be an arbitrage desk selling futures against shares bought in the cash market.
- One day is a short window. A single session's buildup can reverse the next day. Many traders look for the pattern to persist across sessions.
- It says nothing about how far price will go. The framework classifies what happened, not what will happen.
- Lot size changes and corporate actions such as splits or bonuses can change OI figures mechanically.
Using buildup data in practice
Traders often use buildup lists as a starting point for research, not as a signal on their own. A typical process is to look at the list, then check the chart, the option chain, volumes and any news before forming a view. If you want to know whether a rule like "enter on two days of long buildup" would have worked, test it on past data with realistic costs and slippage. Our guide on backtesting option strategies explains how.
F&O trading carries leverage. A SEBI study covering FY22 to FY24 found that about 9 in 10 individual F&O traders made net losses over that period. Buildup data describes market activity; it does not reduce that risk.
See long buildup, short buildup, short covering and long unwinding stocks updated through the day, along with the live option chain for each: start a free trial.