Put-Call Ratio (PCR): What It Is and How Traders Read It
Research & Invest · Updated 8 Nov 2026 · Education, not advice
The put-call ratio, or PCR, is one of the most quoted numbers in Indian options trading. You will see it on market news, in chat groups and on every option chain screen. It is simple to calculate, but it is easy to misread. This guide explains what PCR is, the difference between OI PCR and volume PCR, how traders commonly interpret it, and where it falls short.
What is the put-call ratio (PCR)?
The put-call ratio compares activity in put options with activity in call options for the same underlying and expiry. The basic formula is:
PCR = Total put value ÷ Total call value
"Value" here means either open interest or traded volume, depending on which version you use. A PCR of 1 means puts and calls are equal. Above 1 means there is more put activity; below 1 means there is more call activity.
PCR can be calculated for an index such as Nifty or Bank Nifty, for a single F&O stock, for one expiry, or across all expiries combined. When you compare PCR readings, make sure they are calculated the same way.
OI PCR vs volume PCR: what is the difference?
There are two common versions, and they answer different questions.
| OI PCR | Volume PCR | |
|---|---|---|
| Formula | Total put open interest ÷ total call open interest | Total put volume traded ÷ total call volume traded |
| What it measures | Positions that are still open (the stock of positions) | Trading done today or in a session (the flow) |
| How it moves | Changes gradually as positions are built or closed | Can swing sharply within a day |
| Typical use | Reading overall positioning into an expiry | Reading the mood of the current session |
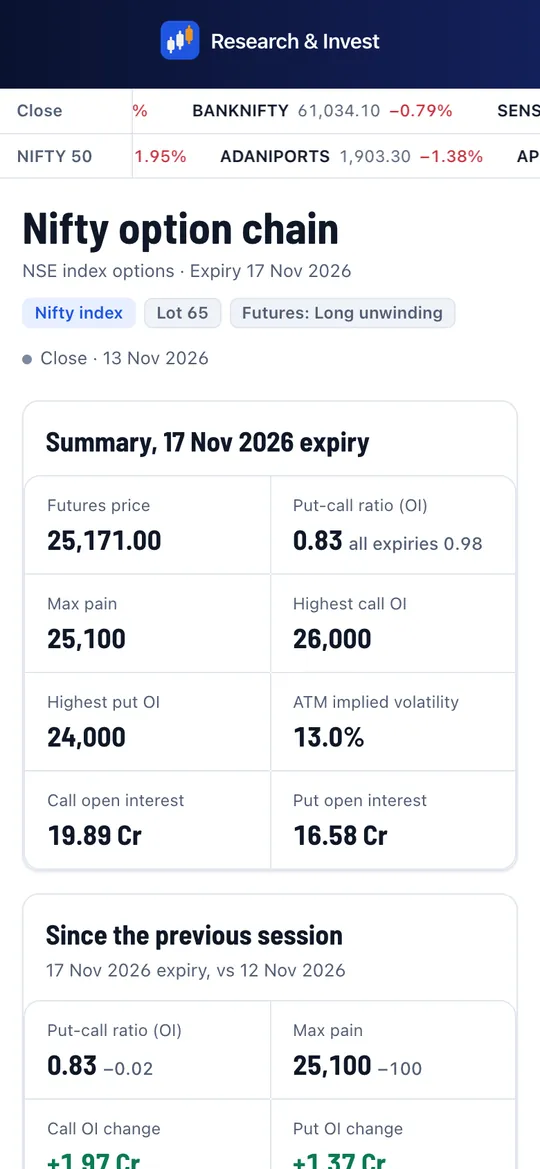
Most option chain screens, including our Nifty option chain, show OI PCR because positions that stay open carry more information than trades that open and close within minutes.
How to calculate PCR: a worked example
Suppose, using illustrative numbers, that the current Nifty expiry shows:
- Total put open interest: 1,20,00,000 units
- Total call open interest: 1,00,00,000 units
OI PCR = 1,20,00,000 ÷ 1,00,00,000 = 1.20.
If, during the same session, 3 crore put units and 4 crore call units traded, the volume PCR would be 3 ÷ 4 = 0.75. The two versions can point in different directions on the same day, which is one reason to know which one you are looking at.
You can also compute a strike-wise PCR by dividing put OI by call OI at a single strike. Traders use this to see which strikes are dominated by put writers or call writers.
How do traders read PCR?
There are two broad schools of thought, and they reach opposite conclusions from the same number. That alone tells you PCR needs context.
The writer's view
In Indian index options, a large share of open interest is held by option sellers (writers), who tend to be better capitalised. On this view, a rising PCR means more puts are being written, so writers expect the market to hold above those strikes. A higher PCR is then read as supportive and a lower PCR as cautious.
The contrarian view
The older, textbook reading treats PCR as a sentiment gauge of option buyers. Very high PCR means many traders are buying puts for protection, which some see as excessive fear that often appears near lows. Very low PCR means heavy call buying, read as excessive optimism. On this view, extremes are warnings of a possible reversal.
What most traders actually watch
In practice, many traders pay less attention to the absolute level and more to:
- The change in PCR through the day or across sessions.
- Extremes relative to that underlying's own history, since "normal" PCR differs between Nifty, Bank Nifty and individual stocks.
- Agreement with price. PCR rising while the index rises tells a different story from PCR rising while the index falls.
What is a "good" PCR value?
There is no universal good or bad value. You will often see rough bands quoted, such as below 0.7 being call-heavy and above 1.3 being put-heavy, but these are rules of thumb rather than tested thresholds. The typical range shifts over time and between underlyings. Comparing today's PCR with that underlying's PCR over the past weeks and months is more useful than comparing it with a fixed number.
What are the limits of the put-call ratio?
- It ignores who opened the position. Open interest counts contracts, not whether the buyer or the seller started them. A put contract may be a bearish bet, a hedge on a long portfolio, or a sold put by someone who expects support.
- Hedging distorts it. Institutions buy index puts to protect equity holdings. That raises PCR without saying much about short-term direction.
- Far OTM strikes add noise. Cheap far OTM options can carry large OI that has little to do with the near-term view. Some traders calculate PCR only for strikes near the money.
- Expiry day behaviour. On expiry, OI drops quickly as positions are closed, and PCR can jump around. Readings on that day are less stable.
- Stock options are thinner. For many single stocks, option volume is low and a few large trades can move the ratio a lot.
- It is not a timing tool. A high or low PCR can persist for days while the market moves the "wrong" way.
How to use PCR alongside other option chain data
PCR is a summary of the option chain, so it reads best next to the details it summarises:
- Check the strikes with the highest call and put OI on the option chain.
- Compare with max pain, another reading derived from the same OI data.
- Watch how price and OI move together using the OI buildup framework.
- Look at implied volatility: a rising PCR with rising IV suggests demand for protection, while a rising PCR with falling IV suggests more put writing.
Any rule you derive from PCR, such as "act when PCR crosses 1.3", should be tested on past data with realistic costs before you rely on it. Our guide on backtesting option strategies covers how to do that honestly.
A note on risk
PCR is a description of positioning, not a forecast. Options are leveraged, and a SEBI study covering FY22 to FY24 found that about 9 in 10 individual F&O traders made net losses. Use PCR to understand the market, not as a signal on its own.
See live PCR, max pain and the full option chain for Nifty, Bank Nifty and every F&O stock on our option chain pages, and test your own rules in the strategy lab: start a free trial.