Implied Volatility Explained: IV Rank, IV Percentile and India VIX
Research & Invest · Updated 8 Nov 2026 · Education, not advice
Implied volatility, or IV, is the one input to an option's price that you cannot look up directly. It is worked out backwards from the premium the market is paying. Understanding IV explains why the same strike can be cheap one week and expensive the next, why premiums fall after big events, and how India VIX fits in. This guide covers what IV is, how IV rank and IV percentile differ, and how IV relates to India VIX.
What is implied volatility in options?
Implied volatility is the level of future volatility that, when put into an option pricing model, produces the option's current market price. It is quoted as an annualised percentage.
The other inputs to the model, such as the underlying price, strike, time to expiry and interest rate, are known. Only volatility is unknown. So platforms take the market premium and solve for the volatility that fits. That number is the IV.
In simple terms:
- Higher IV means the market is paying more for options, because it expects bigger moves or wants protection.
- Lower IV means options are cheaper, because the market expects calmer conditions.
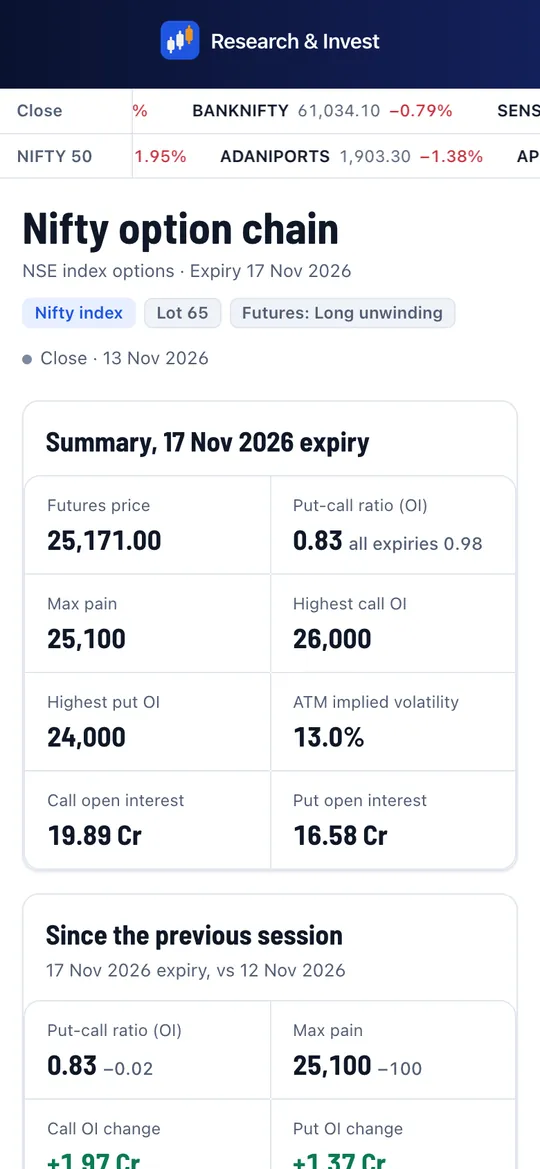
IV is shown for every strike on an NSE-style option chain, for both calls and puts.
Implied volatility vs historical volatility
| Historical (realised) volatility | Implied volatility | |
|---|---|---|
| Based on | Actual past price moves of the underlying | Current option premiums |
| Looks | Backwards | Forwards (what the market is pricing in) |
| Calculated from | Standard deviation of returns, annualised | Option pricing model solved for volatility |
When IV is well above recent historical volatility, options are priced for more movement than has been happening. When IV is below it, options are priced for less. Neither tells you what will happen next.
How to turn IV into an expected move
Because IV is annualised, traders often convert it to a rough expected move over a shorter period using the square root of time. A common approximation uses about 252 trading days in a year.
Illustrative example: Nifty at 24,000 with ATM IV of 14%.
- Daily move ≈ 14% ÷ √252 ≈ 14% ÷ 15.9 ≈ 0.88%, or about 211 points.
- Over 5 trading days ≈ 0.88% × √5 ≈ 1.97%, or about 473 points.
This is a one standard deviation estimate. Under the model's assumptions, the market would stay within that range roughly two-thirds of the time. Real markets have bigger jumps than the model assumes, so treat it as a rough scale, not a boundary.
What is IV rank?
A raw IV number on its own does not tell you much. 18% might be high for Nifty but low for a volatile mid-cap stock. IV rank puts today's IV in context of its own range over a look-back period, usually one year.
IV rank = (Current IV − Lowest IV in period) ÷ (Highest IV in period − Lowest IV in period) × 100
Illustrative example: over the past year, a stock's IV ranged from 12% to 30%. Today it is 18%.
IV rank = (18 − 12) ÷ (30 − 12) × 100 = 6 ÷ 18 × 100 = 33.
An IV rank of 0 means IV is at its yearly low; 100 means it is at its yearly high.
What is IV percentile?
IV percentile asks a different question: on what share of days in the look-back period was IV lower than it is today?
IV percentile = Number of days with IV below today's IV ÷ Total days in period × 100
Illustrative example: using the same stock, suppose IV spent most of the year between 12% and 16%, and only touched 30% briefly during one sharp sell-off. If IV was below 18% on 212 of the last 250 trading days, the IV percentile is 212 ÷ 250 × 100 = 85.
IV rank vs IV percentile: which is better?
The example above shows why the two can disagree. IV rank says 33, which sounds low. IV percentile says 85, which says today's IV is higher than on most days of the year.
| IV rank | IV percentile | |
|---|---|---|
| Uses | Only the high and low of the period | Every day in the period |
| Sensitive to one-off spikes | Yes, strongly | Much less |
| Best for | A quick sense of where IV sits in its range | A fairer picture when the range is distorted by an outlier |
Many traders look at both. When they disagree, it is usually because of a single spike in the look-back window.
What is India VIX and how does it relate to IV?
India VIX is a volatility index published by NSE. It measures the market's expectation of Nifty 50 volatility over the next 30 calendar days, calculated from the prices of Nifty options across a range of strikes in the near and next expiries. NSE's methodology document describes the exact calculation.
Think of India VIX as a blended, standardised IV for the Nifty index:
- It is quoted as an annualised percentage, just like IV. A VIX of 14 means the options market is pricing about 14% annualised volatility for Nifty.
- A rough monthly expected move is VIX ÷ √12. At a VIX of 14, that is about 4% either way.
- India VIX generally tends to rise when the market falls sharply, because demand for protective puts rises. It often eases in steady or rising markets.
- It is about Nifty only. A single stock's IV can be very different, especially around its own results.
Individual Nifty strikes will have IVs above or below India VIX, depending on strike and expiry.
What moves IV?
- Scheduled events. IV typically rises ahead of results, the Union Budget, RBI policy decisions and election results, then often drops once the event passes. This drop is called IV crush.
- Sharp market falls. Fear raises demand for puts, lifting IV, especially on the downside strikes.
- Time to expiry. Very near-dated options can show unusual IV readings because small premium changes translate to large IV changes.
- Supply and demand. Heavy option writing tends to push IV down; heavy buying pushes it up.
What is volatility skew?
IV is rarely the same across strikes. In Indian index options, OTM puts usually carry higher IV than equally distant OTM calls. This pattern, called skew, reflects the market paying more for downside protection. Watching how skew changes can show whether traders are becoming more or less worried about a fall.
How traders use IV
IV is a measure of price, not direction. Traders use it to judge whether options are relatively expensive or cheap compared with their own history, and to understand the vega risk in a position. See option Greeks explained for how vega converts IV changes into rupees, and option strategies for beginners for how different structures react to IV.
A high IV does not mean an option will fall in price, and a low IV does not mean it will rise. Any rule based on IV rank or percentile should be tested on past data first; see backtesting option strategies.
A SEBI study covering FY22 to FY24 found that about 9 in 10 individual F&O traders made net losses. Understanding IV is part of understanding what you pay for an option.
See IV for every strike on the live option chain, along with PCR and max pain, and test strategies in the strategy lab: start a free trial.