How to Read an Option Chain (NSE): Every Column Explained
Research & Invest · Updated 8 Nov 2026 · Education, not advice
An option chain is a single table that lists every strike price for one underlying and one expiry, with calls on one side and puts on the other. If you trade Nifty, Bank Nifty or stock options, it is the screen you will look at most. This guide explains each column of an NSE-style option chain, what the shading means, and how traders read the numbers together without over-reading them.
What is an option chain?
An option chain is a list of all the option contracts available for an underlying (an index like Nifty 50, or a stock) for a chosen expiry date. Each row is one strike price. The left half of the row shows data for the call option (CE) at that strike, and the right half shows the put option (PE) at the same strike. The strike column sits in the middle.
Above the table you usually see the underlying's current value, the expiry selected and the time of the last update. Always check the expiry first: a weekly and a monthly contract at the same strike are different instruments with different prices.
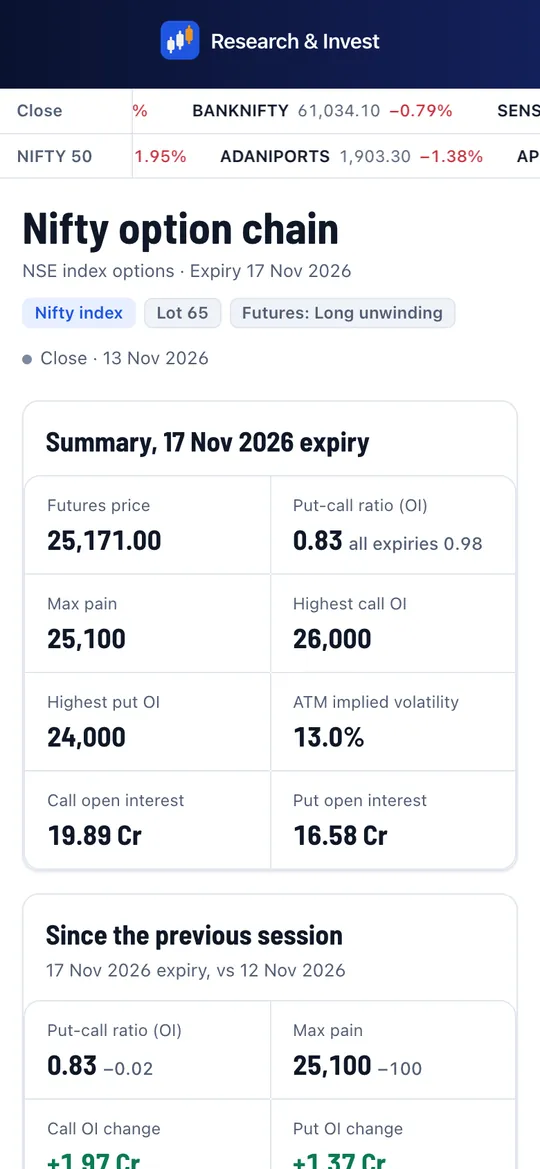
You can open a live chain for any F&O underlying from our option chain hub, for example the Nifty option chain or the Bank Nifty option chain.
Option chain columns explained
The call side and the put side carry the same set of columns, mirrored around the strike. Here is what each one means.
| Column | What it shows | How traders use it |
|---|---|---|
| OI (open interest) | Number of contracts still open at that strike: positions that have been opened and not yet closed or expired. | Shows where positions are concentrated. High call OI and high put OI strikes are often watched as possible resistance and support zones. |
| Change in OI | How much OI has risen or fallen since the previous day's close. | Shows where fresh positions are being added today, or where traders are exiting. |
| Volume | Number of contracts traded today at that strike. | Shows activity and liquidity. A strike with high OI but almost no volume may be hard to trade at a fair price. |
| IV (implied volatility) | The volatility implied by the option's current price, shown as an annualised percentage. | Tells you whether options are priced richly or cheaply relative to their own history. |
| LTP (last traded price) | The premium at which the last trade happened. | The headline price, but it can be stale on thinly traded strikes. |
| Change (net change) | LTP minus the previous close, in rupees or points. | Shows how much the premium has moved today. |
| Bid qty / Bid price | The best price buyers are currently offering, and how many units they want at that price. | The price you are likely to get if you sell immediately. |
| Ask price / Ask qty | The best price sellers are asking, and the quantity available. | The price you are likely to pay if you buy immediately. |
| Strike price | The price at which the option can be exercised. | The anchor for every row. |
One detail to check on any chain you use: whether OI and volume are shown in number of contracts or in number of shares or units. One contract equals one lot, and lot sizes differ between underlyings (see what lot size means). Comparing raw numbers across underlyings only makes sense when the unit is the same.
What do ITM, ATM and OTM mean on the chain?
Every strike is either in the money (ITM), at the money (ATM) or out of the money (OTM), depending on where the underlying is trading.
- Calls are ITM when the strike is below the current price. A 23,800 call is ITM when Nifty is at 24,000, because it already has 200 points of intrinsic value.
- Puts are ITM when the strike is above the current price. A 24,200 put is ITM when Nifty is at 24,000.
- ATM is the strike closest to the current price, here 24,000. Both its call and put are almost entirely time value.
- OTM is the opposite side: calls with strikes above the price and puts with strikes below it. Their premium is entirely time value.
Most option chains shade the ITM cells so you can see the boundary at a glance. Because ITM calls sit above the ATM row and ITM puts sit below it, the shading on the call side and the put side runs in opposite directions. The row where the shading switches is roughly where the underlying is trading now.
How to read an option chain step by step
- Pick the underlying and expiry. Check the expiry against the F&O expiry calendar so you know how many days are left.
- Find the ATM strike. Locate the strike nearest the underlying's price and note the premiums of its call and put. Their sum gives a rough idea of how much movement the market is pricing in before expiry.
- Scan OI on both sides. Find the call strike with the highest OI above the price and the put strike with the highest OI below it. Many traders treat these as zones the market is watching, not as fixed walls.
- Look at change in OI. Strikes where OI is rising sharply today tell you where new positions are being written. Strikes where OI is falling tell you where positions are being closed.
- Check volume and the bid-ask spread. A narrow spread with steady volume means you can enter and exit close to the quoted price. A wide spread is a hidden cost.
- Compare IV across strikes. IV is rarely flat. OTM puts often carry higher IV than OTM calls in Indian indices, a pattern called the skew. Read more in our guide to implied volatility.
A worked example (illustrative numbers)
Suppose Nifty is at 24,010 and the chain shows the following for the nearest expiry. These numbers are made up to show the reading process, not taken from any real day.
| Call OI | Call chg in OI | Call LTP | Strike | Put LTP | Put chg in OI | Put OI |
|---|---|---|---|---|---|---|
| 18,000 | +1,000 | 265 | 23,800 | 52 | +9,000 | 62,000 |
| 25,000 | +2,500 | 185 | 23,900 | 74 | +7,500 | 48,000 |
| 41,000 | +6,000 | 118 | 24,000 | 106 | +5,000 | 44,000 |
| 58,000 | +11,000 | 68 | 24,100 | 155 | +1,500 | 22,000 |
| 71,000 | +14,000 | 36 | 24,200 | 225 | +500 | 12,000 |
A trader reading this would note that the largest call OI, and the largest fresh addition, is at 24,200, while the largest put OI is at 23,800. The ATM straddle (24,000 call plus put) costs about 224 points. That gives a picture of where option writers are positioned and how much movement is priced in. It does not tell you which way the index will go.
Common mistakes when reading the option chain
- Treating high OI as a fixed wall. A strike with large call OI can be crossed. When it is, the same writers may rush to cover, which can speed the move up.
- Ignoring who is on the other side. Every open contract has a buyer and a seller. OI alone does not tell you whether buyers or sellers started the position; price movement and change in OI together give a better clue (see OI buildup explained).
- Trusting LTP on illiquid strikes. Far OTM or deep ITM strikes may not have traded for a while. Look at the bid and ask instead.
- Mixing expiries. Weekly and monthly contracts behave differently near expiry. Read more in weekly vs monthly expiry.
Which indicators are built from the option chain?
Several popular readings are just summaries of the chain:
- Put-call ratio (PCR): total put OI divided by total call OI. See put-call ratio explained.
- Max pain: the strike at which option buyers as a group would receive the least at expiry. See max pain theory.
- The Greeks: delta, gamma, theta and vega for each strike. See option Greeks explained.
Each of these is a lens, not a forecast. They are most useful when read together and with an understanding of their limits.
A note on risk
Options are leveraged instruments and premiums can fall to zero by expiry. A SEBI study covering FY22 to FY24 found that about 9 in 10 individual F&O traders made net losses over that period. Reading the option chain well helps you understand what you are trading; it does not remove that risk.
See the live option chain, PCR and max pain for every F&O stock and index, and test strategies in the strategy lab: start a free trial.