Market Atlas: the whole market on one screen
See the market's mood, breadth, which sectors are leading, unusual volume, FII and DII flows and the F&O picture in seven simple cards, each with a "how to read this" note.
Chapters
8Try Market Atlas yourself. Included in the 1-day free trial.
Open Market AtlasWhat the video shows
Market Atlas shows where money is moving today, in seven cards. Market mood turns seven measures (how many shares rose, how many are above their averages, new highs and lows, India VIX, FII buying and NIFTY's put-call ratio) into one number from 0 to 100, from Fear to Greedy, with the exact formula on the page. Breadth shows whether the whole market is moving or just a few big names.
The sector heatmap shows every NIFTY 500 industry, green for up and red for down, sized by value, for today, a week or a month; tap a sector to see its shares. Sector rotation shows which sectors are leading NIFTY and gaining steam, and which are lagging. Volume shockers are shares that traded far more than usual, with delivery % to show whether buyers took the shares home. Institutional flows show whether foreign (FII) and Indian (DII) institutions bought or sold, and the F&O snapshot shows long and short build-up, PCR and max pain.
Market Atlas is research information, not a recommendation to buy or sell.
More videos
-
 Length 4:40
Investor awareness
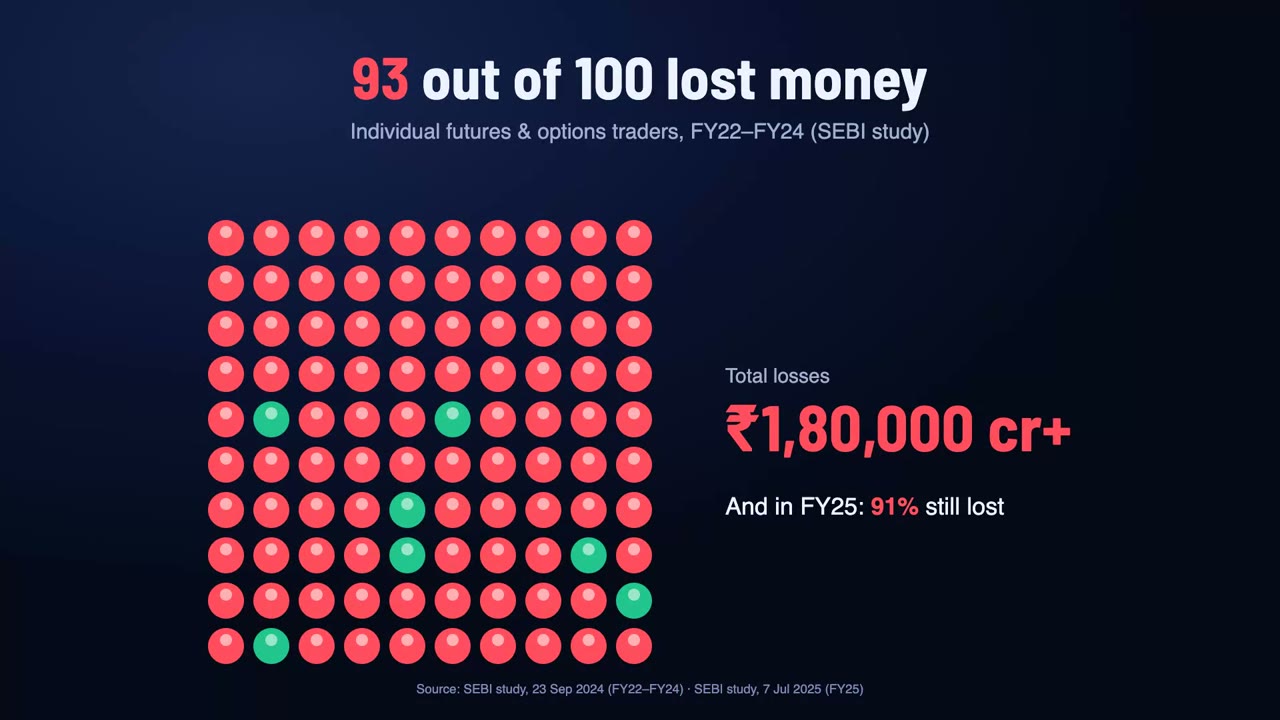
Check before you trust: stock tips, Telegram groups and SEBI registration
Why "sure-shot" stock tips from unregistered people on Telegram, WhatsApp, Instagram and YouTube are dangerous, what SEBI's rules say, the red flags, how to check a Research Analyst's registration, and where to complain if you are cheated. -
 Length 3:12
For members
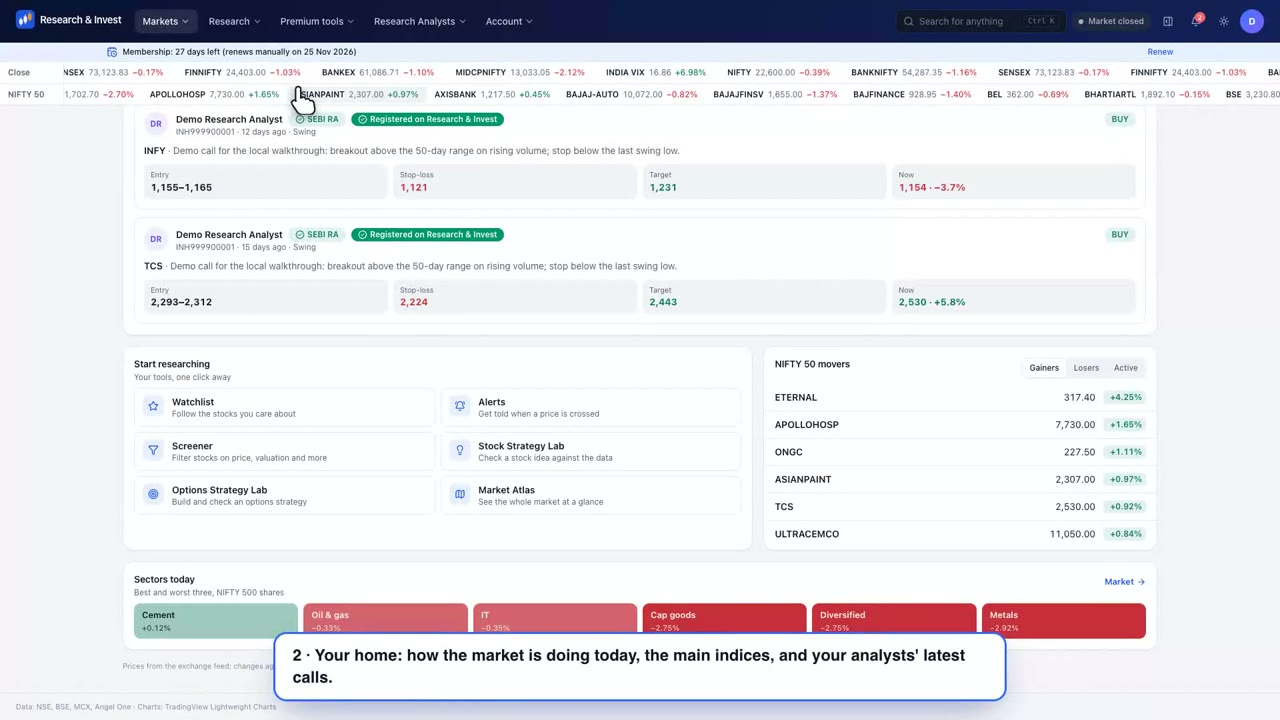
How Research & Invest works for investors
A three-minute tour for members: joining, your home page, the markets, the research tools, alerts, and following SEBI-registered Research Analysts in My Feed. -
 Length 3:04
For Research Analysts
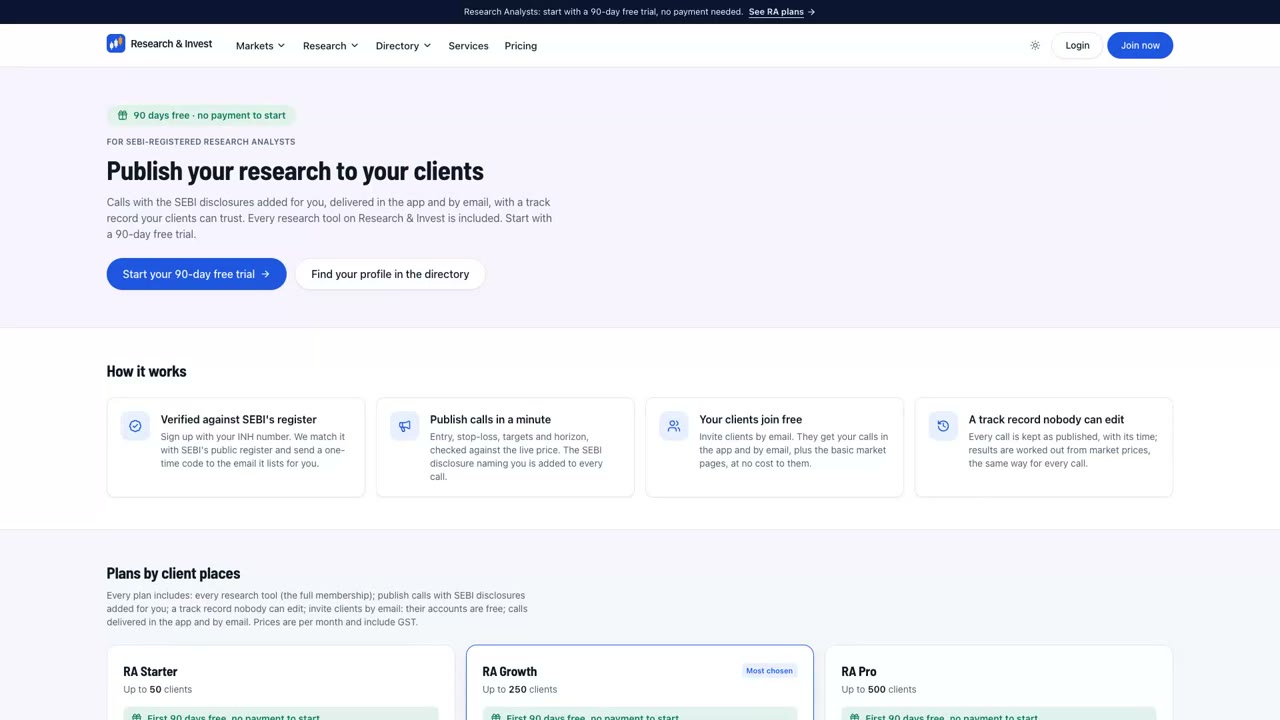
For Research Analysts: join, publish calls and grow your clients
How a SEBI-registered Research Analyst joins Research & Invest: the SEBI-register check, plans by client places, your public profile and photo, publishing a call with the disclosures added for you, a track record nobody can edit, clients, and how investors follow you. -
 Length 2:14
Portfolio X-ray
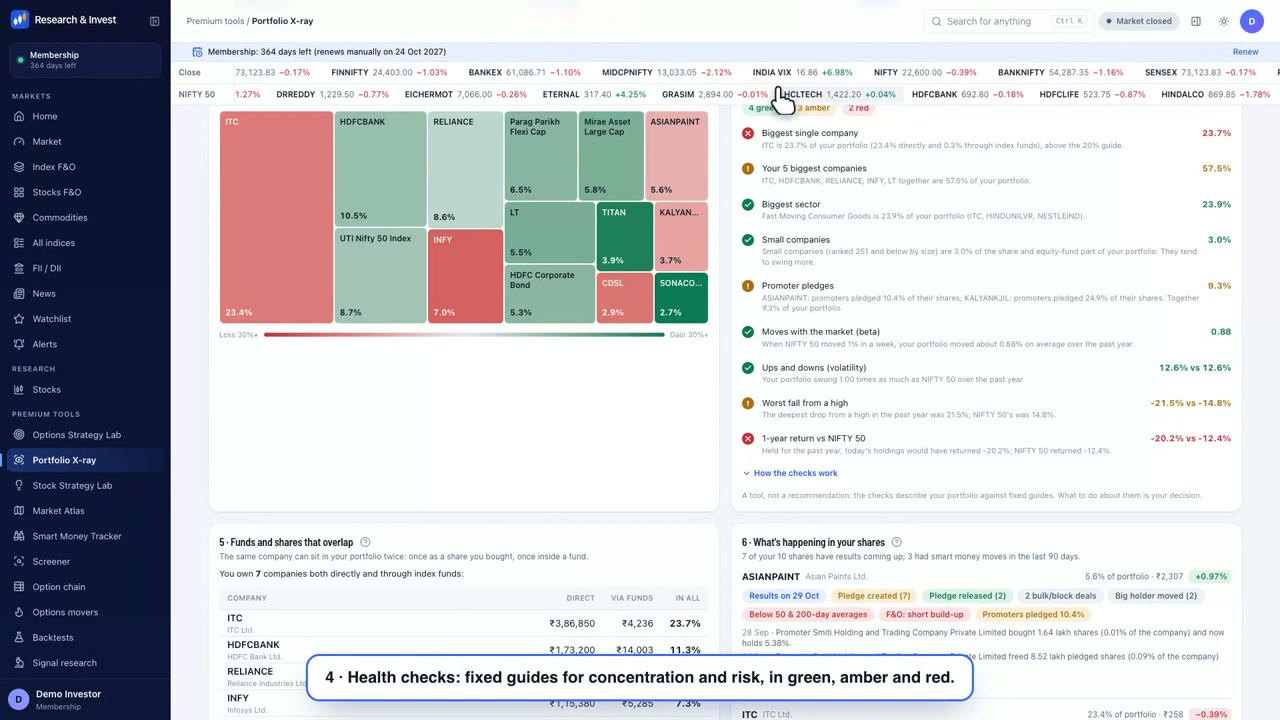
Portfolio X-ray: see what is really inside your portfolio
Upload your CAS statement or broker holdings file and see where your money sits, the concentration and risk checks, overlap between your funds and shares, and what is happening in each share. -
 Length 3:45
Options Strategy Lab
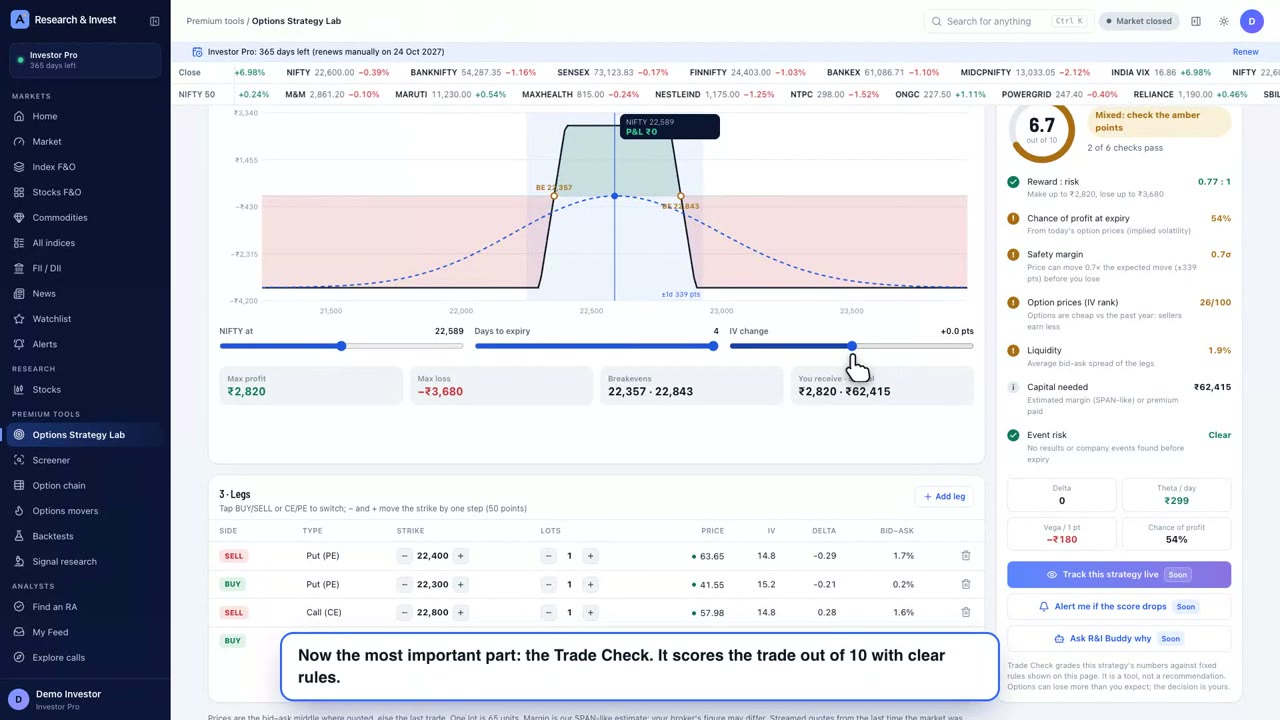
Options Strategy Lab: build and check an options trade
See how to turn your view on NIFTY into an options trade, read what it can gain or lose before you place it, and check how sound it is with the Trade Check score. -
 Length 2:18
Stock Strategy Lab
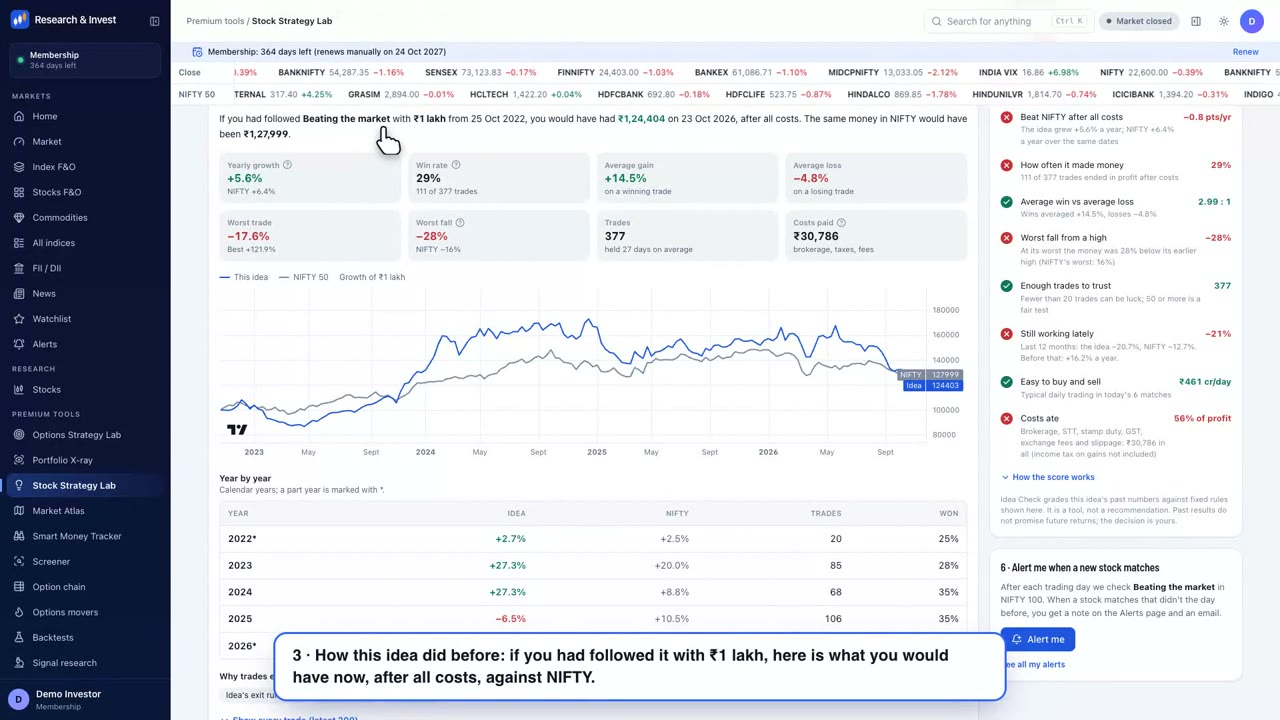
Stock Strategy Lab: find stocks and see how the idea did before
Pick a ready-made stock idea in plain words, see today's matching stocks, and see exactly how the idea did over the past years after all costs, compared with NIFTY.